How Vision Analytics Improves DOOH Campaigns
Vision analytics turns DOOH screens into real-time, privacy-first audience measurement tools that improve targeting, engagement and measurable ROI.
How Vision Analytics Improves DOOH Campaigns
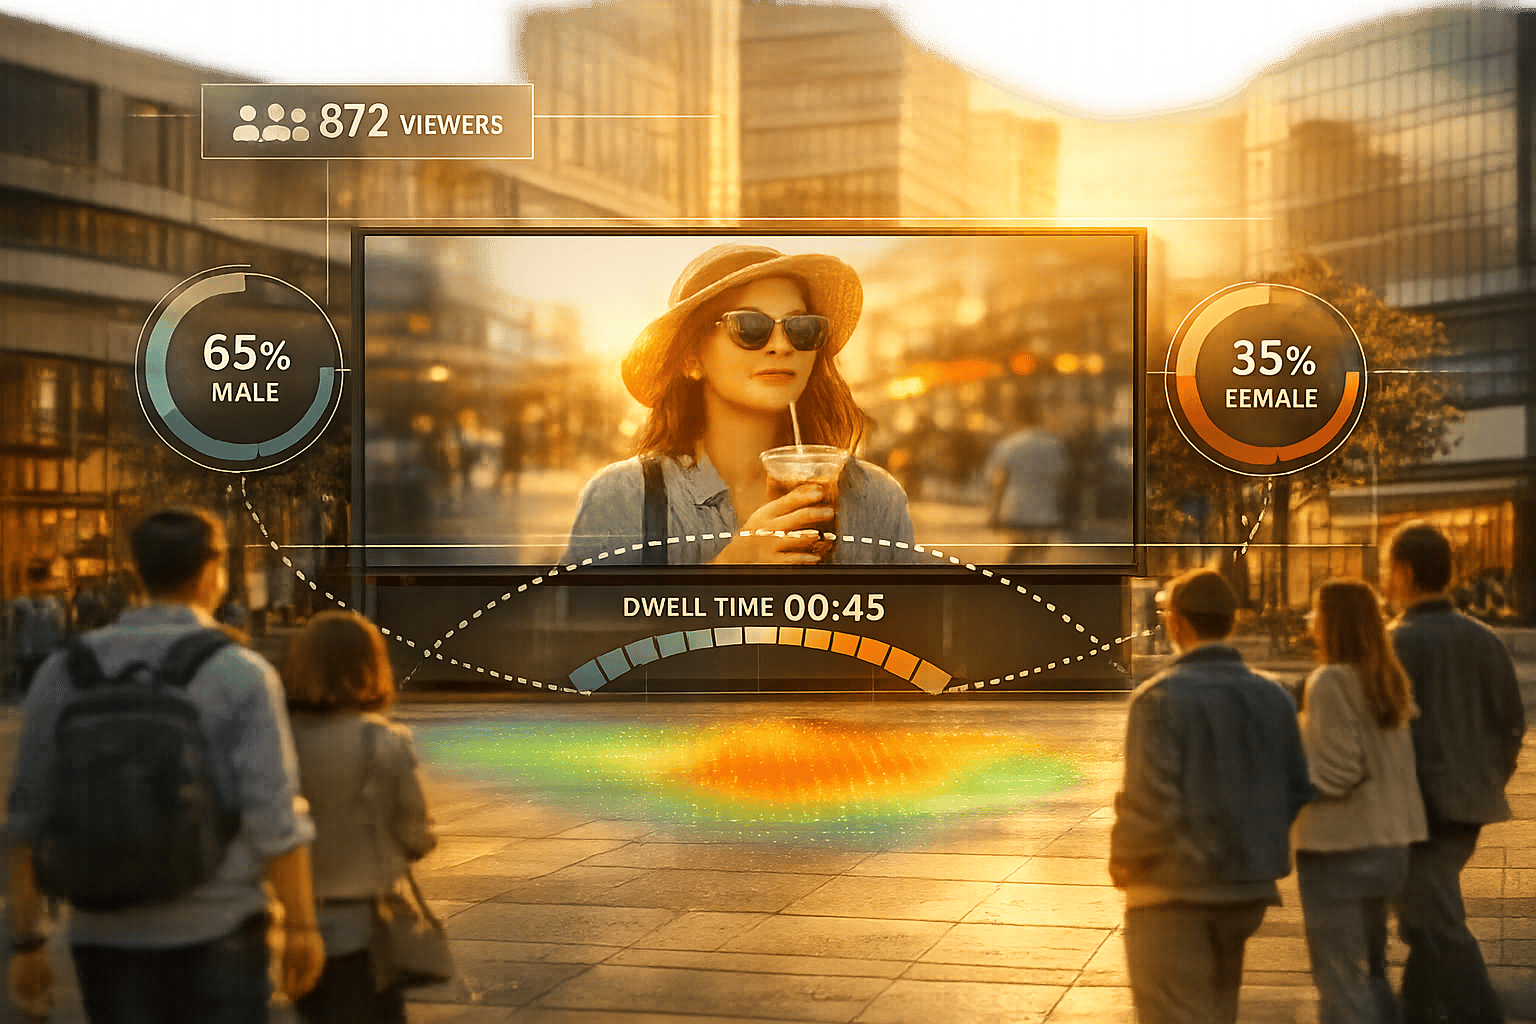
Vision analytics is reshaping Digital Out-of-Home (DOOH) advertising by offering precise, real-time audience data through AI-powered cameras and sensors. Unlike older methods relying on estimates, this technology measures viewer engagement with metrics like impressions, dwell time, and gaze direction, all while maintaining privacy by avoiding the storage of identifiable data. Here's what it means for advertisers:
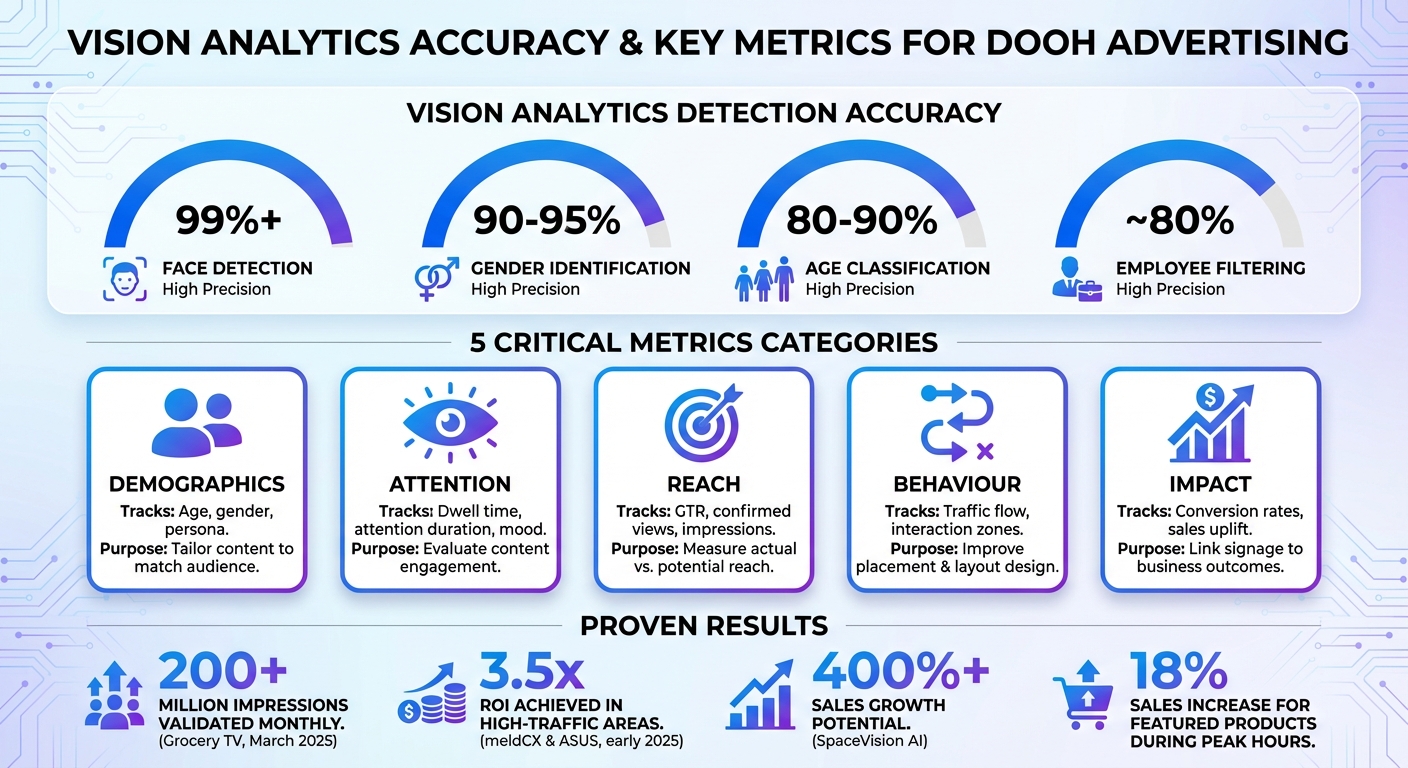
- Accurate Viewer Insights: Detects age, gender, mood, and engagement levels with up to 99% accuracy in face detection.
- Improved Campaign Performance: Tracks metrics like dwell time, attention duration, and Gaze-Through Rate (GTR) to refine content and placement.
- Real-Time Adjustments: Automatically adapts content based on audience demographics or behaviours, maximising relevance.
- ROI Tracking: Links audience data to sales metrics, helping advertisers measure and improve returns on campaigns.
Precise OOH/DOOH Analytics: Pedestrian Tracking & Emotional Response Demo
sbb-itb-c231c83
How Vision Analytics Measures Audiences
Vision Analytics Metrics and Accuracy Rates for DOOH Advertising
Vision analytics transforms DOOH (Digital Out-of-Home) screens into tools for measuring audience behaviour with precision. By analysing demographics and behavioural patterns, this technology provides advertisers with a clear understanding of who is viewing their content and how they are interacting with it. This data allows campaigns to be adjusted dynamically for better results.
Tracking Demographics and Engagement
Modern vision analytics systems use facial expression analysis to identify key demographic traits like age, gender, and even mood. These systems can detect emotional states such as curiosity, surprise, interest, or indifference, offering insights into both the viewer's profile and their reactions to the content. The accuracy rates are impressive: over 99% for face detection, 90–95% for identifying gender, and 80–90% for classifying age groups.
In addition to demographics, these systems track engagement metrics. Dwell time measures how long someone remains within a certain proximity, while attention time calculates how long they actively view the screen. Another key metric is the Gaze-Through Rate (GTR), which shows the percentage of people who actually viewed the content compared to the total who had the chance to see it. Advanced systems even filter out employee views with about 80% accuracy to ensure the data reflects genuine audience behaviour.
Here’s a breakdown of key metrics and their applications:
| Metric Category | What It Tracks | Why It Matters |
|---|---|---|
| Demographics | Age, gender, persona | Helps tailor content to match the audience present |
| Attention | Dwell time, attention duration, mood | Evaluates how engaging the content is |
| Reach | GTR, confirmed views, impressions | Measures actual exposure compared to potential reach |
| Behaviour | Traffic flow, interaction zones | Improves screen placement and store layout design |
| Impact | Conversion rates, sales uplift | Directly links signage to business outcomes |
These metrics enable advertisers to make real-time improvements and create detailed strategies based on audience behaviour.
Real-Time Data Collection and Reports
Vision analytics systems go beyond gathering audience metrics - they provide real-time insights that allow for immediate campaign adjustments. Using edge AI technology, data is processed locally on the device rather than being sent to the cloud. This ensures faster processing, better privacy, and near-instantaneous feedback.
For example, in March 2025, Grocery TV used wide-angle front cameras with computer vision to validate over 200 million impressions monthly on retail checkout displays. Their system only triggered when a customer stepped into the checkout lane, capturing engagement metrics without storing any personal data.
"Vision Analytics brings you up-to-date information right on your screen as it is happening anytime, anywhere in your network." - onQ Digital
The system also generates detailed performance reports, enabling advertisers to refine campaigns while they are live. These reports allow adjustments like optimising content length based on attention data, comparing GTR across different screen locations, and automating day-parting schedules. For instance, family-focused promotions could run between 3 PM and 5 PM if data indicates higher child traffic during that window.
Using Vision Analytics for Real-Time Targeting
Vision analytics is revolutionising DOOH (Digital Out-of-Home) advertising by enabling screens to deliver dynamic, real-time content tailored to the audience in front of them.
This approach transforms static displays into interactive tools that respond to viewers on the spot. By analysing audience data instantly, advertisers can display content that aligns with the viewer's profile and behaviour at that very moment.
Adjusting Content Dynamically
One of the standout features of vision analytics is its ability to adjust content based on live audience data. Cameras detect specific demographic traits or behaviours, and the Content Management System (CMS) uses pre-set rules to adapt the advertisements shown. For example, if someone pauses in front of a screen for a few seconds, the system might transition from a general brand advertisement to a detailed product pitch or even a direct call-to-action.
"With vision analytics, an ad for a similar product could be displayed right in front of them on a nearby digital signage screen, encouraging them to make a purchase decision in the moment." - meldCX
High-performance edge AI can process up to 25 channels of analytics on a single device, making it possible to set sophisticated triggers for real-time targeting. For instance, a screen might show youth-focused content when the audience skews younger or switch to luxury product promotions when engagement metrics suggest heightened interest. These dynamic changes rely on CMS rules that automatically align content with audience characteristics.
But it doesn’t stop at demographics - environmental factors also play a big role in refining targeting strategies.
Contextual Targeting Based on Environment
Vision analytics doesn’t just focus on who is watching; it also considers the broader environment to ensure the content is highly relevant. Factors like time of day, foot traffic levels, and location-specific patterns guide what content is displayed. For example, a retail screen might promote breakfast specials during the morning rush and switch to lunch deals as the day progresses, all based on real-time footfall and historical engagement trends.
Optimising Campaigns with Vision Analytics Data
Vision analytics provides insights that help fine-tune creative strategies and make better use of DOOH campaign budgets.
Improving Creative Performance
Vision analytics gives advertisers a clear picture of which creative assets connect with audiences. By tracking metrics, it identifies content that grabs attention versus content that falls flat. For example, if a display garners plenty of impressions but shows a low attention rate, it might indicate that the creative lacks the "stopping power" needed to engage viewers effectively.
This data is particularly useful for A/B testing. Advertisers can test different versions of creative content on various screens to see which one captures audience attention more effectively. A great example of this comes from early 2025, when meldCX and ASUS used vision analytics across hundreds of retail screens. By dynamically adjusting content based on real-time audience data, they achieved up to 3.5× ROI in high-traffic areas.
Vision analytics also helps detect when engagement drops, which can signal viewer fatigue or outdated content. It can even highlight demographic mismatches, prompting timely adjustments to ensure the content remains relevant.
By leveraging these insights, advertisers can not only improve the performance of their creative assets but also see a direct boost in ROI.
Tracking and Improving ROI
Tying vision analytics to business outcomes is key to measuring ROI effectively. The standard formula for ROI is:
ROI = (Total Benefits – Total Costs) ÷ Total Costs × 100.
Vision analytics evaluates ROI by assessing operational efficiency, audience engagement, and business impact. For example, integrating vision analytics with Point of Sale (POS) systems allows advertisers to link specific creative displays to actual sales results. In one case, prioritising engaging content during peak shopping hours led to an 18% sales increase for a featured product.
"If analytics are the engine, ROI measurement is the destination." – Navori
Tools like heat maps and movement tracking also add value by identifying areas with less activity. This information helps operators optimise screen placement or adjust content strategies. Using foot traffic data, advertisers can reserve high-traffic time slots for impactful "power content" rather than generic brand messages, further enhancing campaign results.
These insights integrate smoothly with Adflux CMS, making campaign management more efficient and effective.
Using Vision Analytics with Adflux CMS
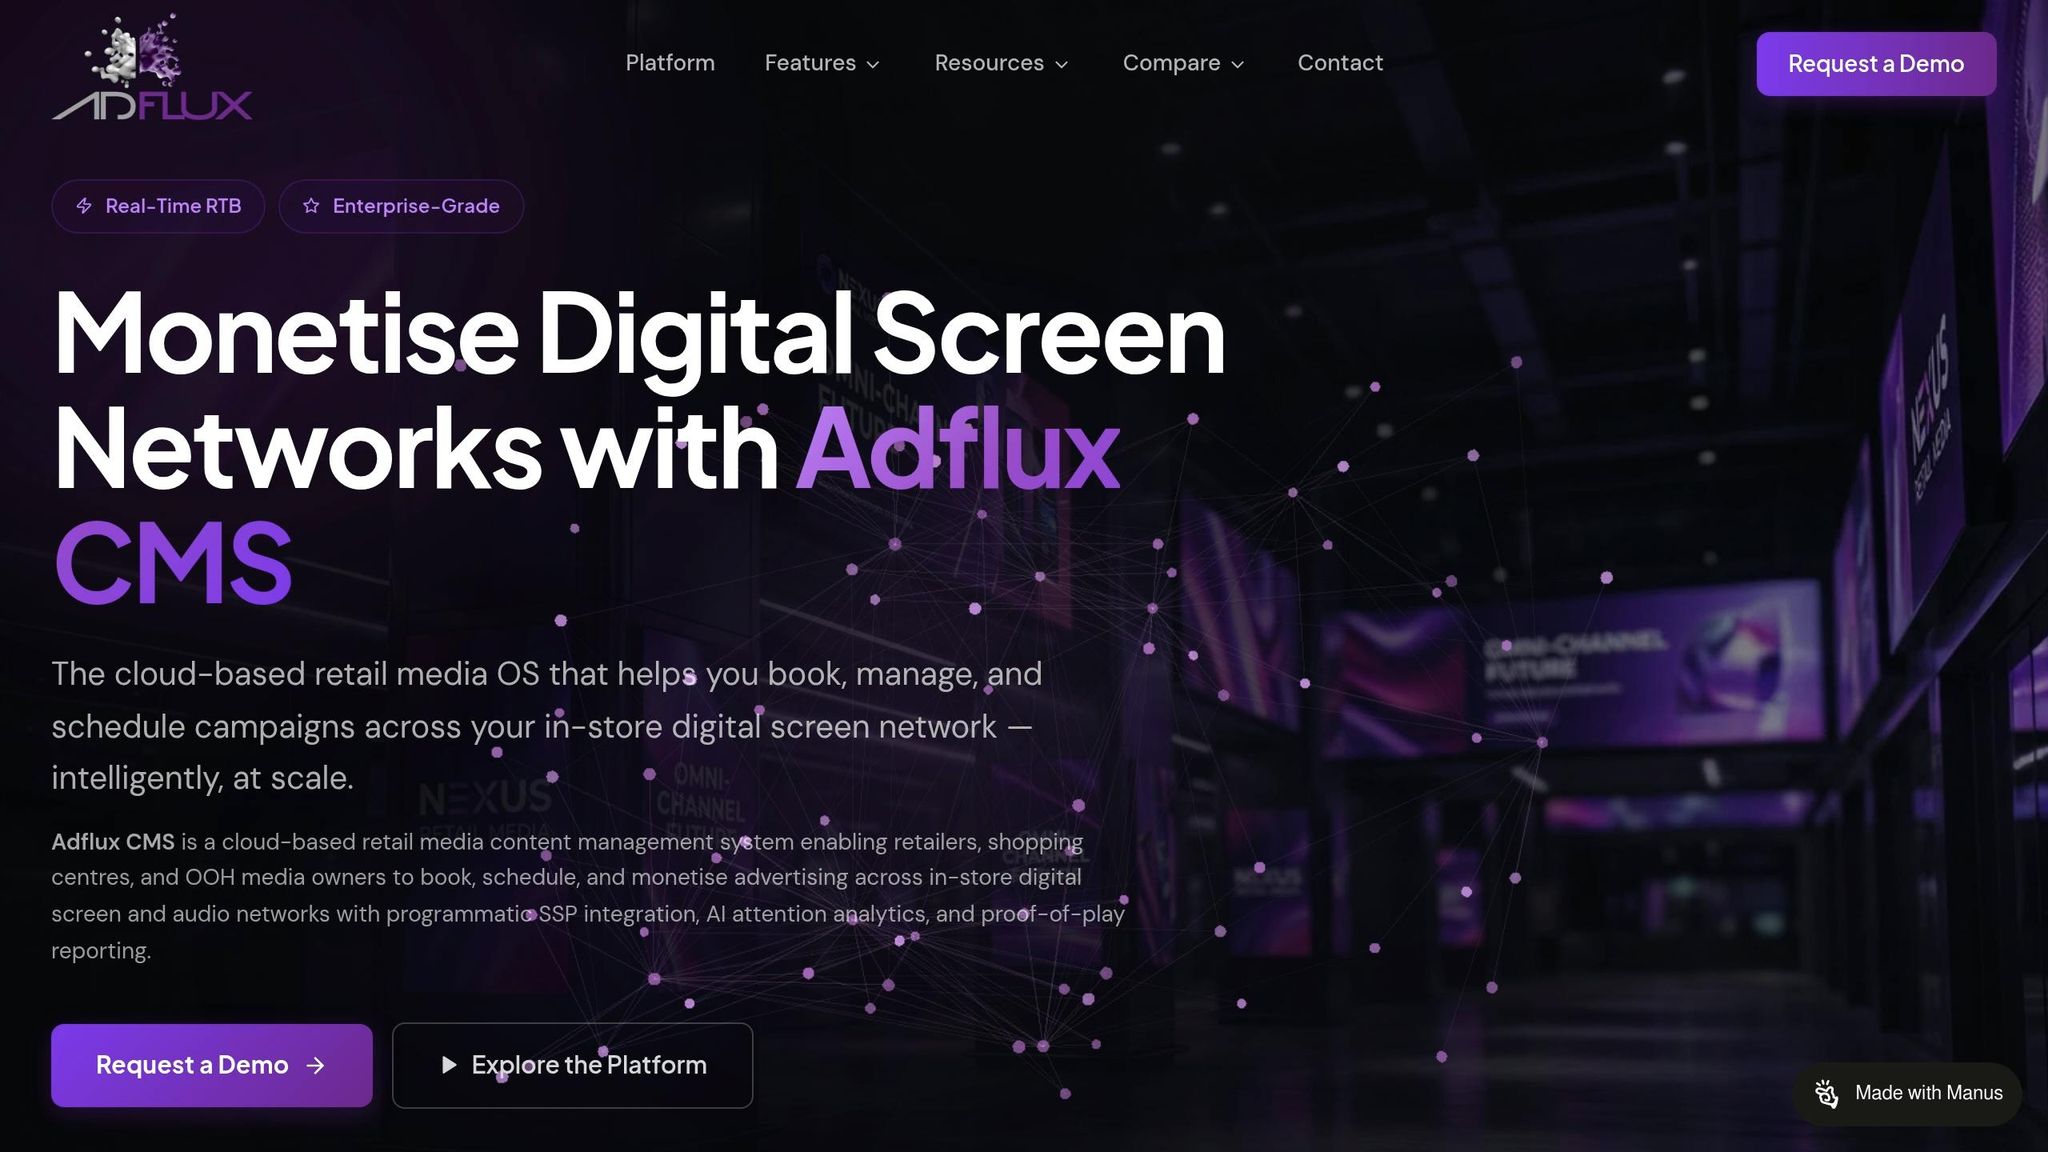
Adflux CMS integrates vision analytics directly into its platform, removing the need for juggling multiple systems. This integration simplifies how campaigns are managed while providing the audience insights that make digital out-of-home (DOOH) advertising more impactful.
Adflux CMS Vision Analytics Features
Adflux CMS works seamlessly with third-party vision analytics tools to estimate viewer demographics, such as age and gender, as they approach a screen. Importantly, this data is processed without storing personal information, adhering to strict privacy regulations.
The platform uses real-time audience data to display targeted content automatically. For instance, if sensors detect a group of 18–25-year-olds, the system can instantly switch to a "Youth Fashion" playlist - no manual adjustments needed. This rule-driven automation lets marketers set parameters that operate continuously in the background.
Adflux CMS also links playback history with viewer engagement metrics to create detailed reports. By combining proof-of-play logs with data like attention time, the platform helps advertisers identify which creative content resonates most with their audience.
Managing Campaigns More Efficiently
Beyond its analytics capabilities, Adflux CMS simplifies campaign management by centralising all digital signage operations into a single cloud-based interface. This allows marketers to oversee campaigns across multiple locations from one dashboard, ensuring consistency while offering flexibility for local adjustments.
"Adflux CMS automates every aspect of your retail media operations, from content generation to campaign deployment and media sales." – AdFlux Australia
Its Content Automation feature updates campaign details - such as pricing, images, and product availability - using real-time data feeds. Retailers can leverage the Adflux digital signage API to sync content with inventory databases, ensuring screens promote products that are currently in stock. Additionally, screen grouping lets operators update hundreds of displays simultaneously, eliminating the need for manual adjustments.
Remote health monitoring keeps track of each screen's last displayed image and connectivity status, ensuring campaigns run smoothly. Just like its analytics tools, this reporting feature provides advertisers with a full view of both campaign performance and audience engagement.
Conclusion: How Vision Analytics Improves DOOH Campaigns
Vision analytics takes digital out-of-home (DOOH) advertising from being a passive medium to an active, data-driven strategy. By providing real-time demographic insights, behavioural tracking, and dynamic ad triggers, it ensures ads are delivered to the right audience at the right time.
These advancements aren't just theoretical - they deliver tangible results. For instance, SpaceVision AI has shown that using AI-driven audience engagement tracking can lead to sales growth of 400% or more. This isn't just a minor improvement; it's a game-changer for how DOOH campaigns generate returns.
"With data flowing in live, marketers can optimize ad content by the hour, maximizing ROI on ad spend." - Iryna Solovyova, Displai
In addition to boosting sales, vision analytics provides a clear way to measure campaign effectiveness. By linking screen engagement data with Point-of-Sale results and foot traffic patterns, advertisers can calculate conversion rates and deliver solid ROI metrics to stakeholders. This data-driven approach replaces guesswork with actionable insights.
The technology also supports omnichannel integration, combining offline data with online first-party insights to build detailed customer profiles. When paired with tools like Adflux CMS (https://adflux.digital), which automates content delivery based on real-time triggers, vision analytics ensures campaigns are continuously fine-tuned for peak performance.
FAQs
How does vision analytics protect people’s privacy?
Vision analytics takes privacy seriously by working exclusively with anonymised data instead of collecting personally identifiable information (PII). For instance, it examines customer behaviour - such as foot traffic, dwell times, and demographic trends - without capturing or storing details that could identify individuals.
The technology emphasises aggregated patterns and general metrics, ensuring it aligns with privacy laws. Since no personal images or data are recorded, businesses can fine-tune their campaigns while maintaining a strong commitment to protecting individual privacy.
What’s the difference between impressions, dwell time and GTR?
Impressions represent how many times an ad is seen, dwell time measures the duration viewers spend engaging with the content, and GTR (Gross Traffic Revenue) captures the total income generated by the campaign. Impressions highlight the ad's reach, dwell time reflects viewer engagement, and GTR provides a snapshot of the campaign's financial outcomes.
How do I connect vision analytics results to sales ROI?
To tie vision analytics to sales performance, start by leveraging audience insights like engagement levels, demographics, and dwell times. Use this data to fine-tune your digital signage campaigns. Then, compare sales metrics - such as conversion rates or sales increases - before and after these adjustments to measure the impact.
By combining audience data with sales figures, you can pinpoint which strategies work best. This approach not only helps refine campaigns but also ensures they deliver noticeable improvements to sales outcomes.
Adflux Editorial
Retail media, programmatic DOOH, and digital signage insights for Australian retailers.
Ready to build your retail media network?
Talk to the Adflux team about how the platform can work for your screens.