Digital Signage KPIs: Measuring Campaign Impact
Measure digital signage impact with KPIs like sales lift, impressions and engagement; integrate POS and inventory, and use proof-of-play for accurate ROI.
Digital Signage KPIs: Measuring Campaign Impact
Digital signage can drive sales by up to 29.5% and attract 80% more customers to stores with displays. But measuring its success requires tracking the right metrics. Surprisingly, over 60% of businesses lack a clear ROI strategy, leaving them unable to refine campaigns or justify investments.
Here’s what you need to know:
- Key Metrics: Sales uplift, impressions, engagement (dwell time, interaction rates), and ROI.
- Tools: Advanced platforms like Adflux CMS integrate real-time data (inventory, audience demographics) and offer automation, "proof of play" reports, and audience targeting.
- Challenges: Many systems lack integration with sales data, limiting the ability to measure impact beyond impressions. Privacy concerns also arise with facial recognition.
- Results: Businesses tracking KPIs are 27% more likely to outperform competitors over five years.
Choose tools that align with your goals. For revenue-focused campaigns, advanced systems like Adflux CMS deliver deeper insights and automation. For simpler needs, basic systems may suffice, but they often require manual updates and provide limited analytics.
1. Adflux CMS
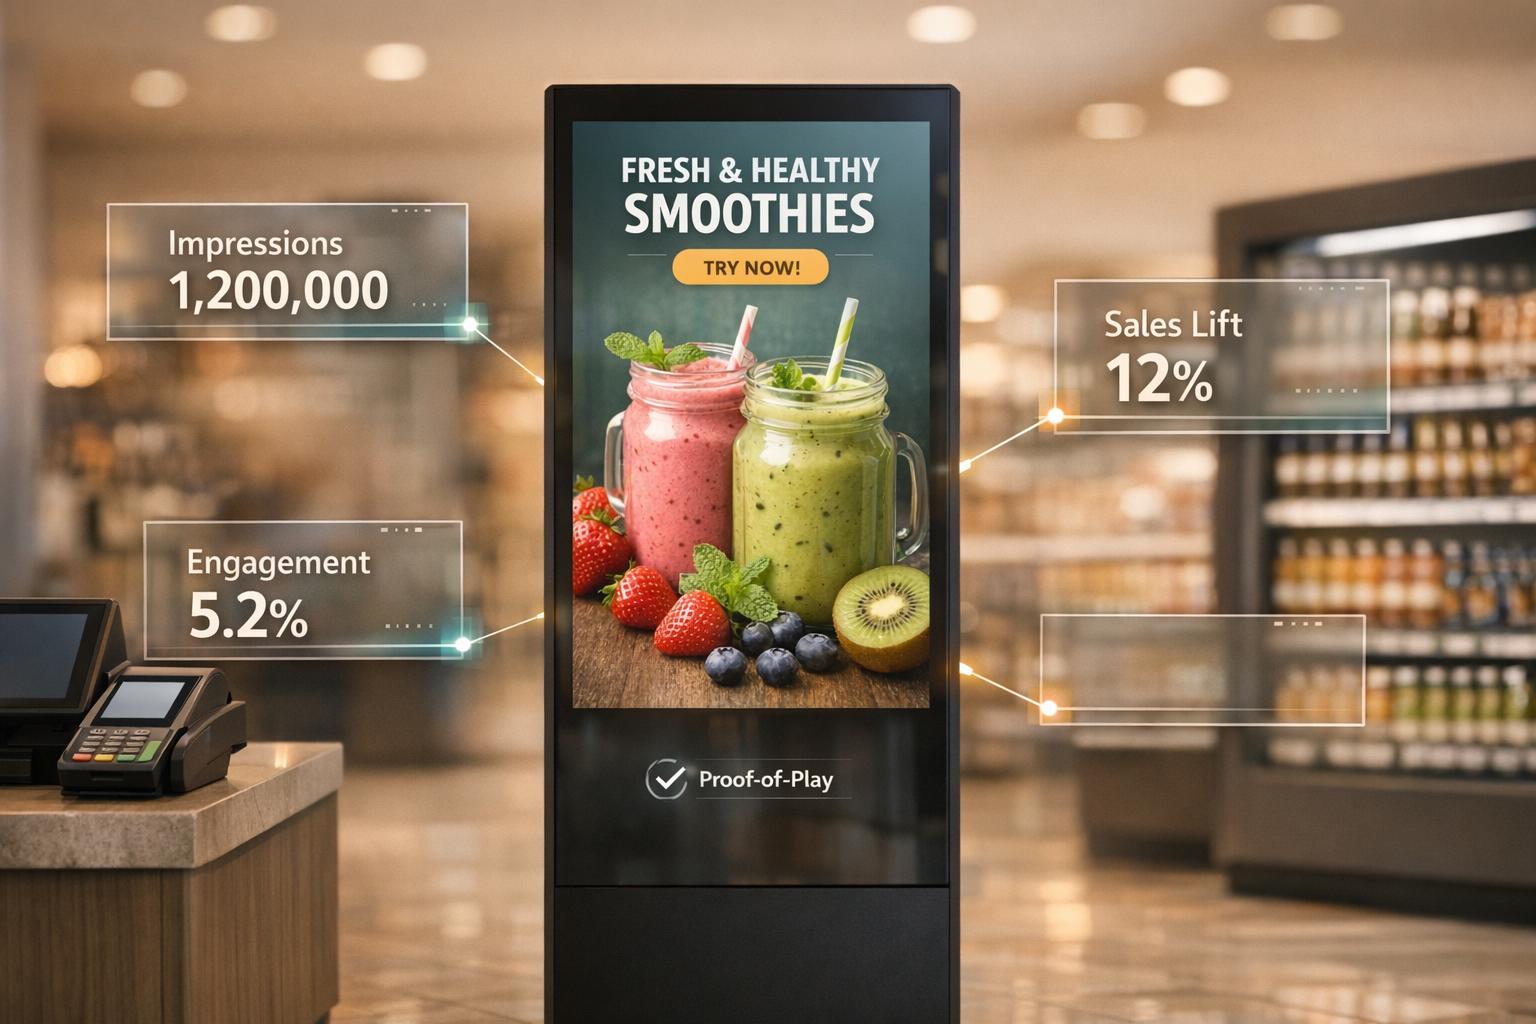
Impressions Tracking
Adflux CMS uses third-party data to estimate the age of customers near screens, helping retailers gauge whether their content is hitting the right audience. This platform captures up to eight times more views compared to traditional visual media formats. Plus, visual elements engage audiences 35% more effectively than text or audio alone.
The platform provides playback reports, detailing device status, performance metrics, and the exact content displayed on each screen - delivering what’s known as "proof of play". Remote monitoring even shows the 'last image displayed' on distant screens, ensuring campaigns are delivered as planned and data remains reliable.
Engagement Metrics
Adflux CMS goes beyond simply tracking impressions - it dives into customer interactions. Using tools like built-in cameras, voice recognition, and proximity sensors, the platform gathers detailed analytics on how customers engage with displays. This sensor-driven technology allows signage to adjust promotions in real-time based on customer behaviour.
The Adflux API also connects digital signage with external data sources, like inventory databases. This ensures screens only advertise products that are actually in stock, preventing the frustration of promoting unavailable items. Campaigns are automatically tailored to match audience demographics, location, and timing for maximum impact.
ROI Measurement
Adflux supports a variety of sales channels, including direct sales, self-service portals for brand partners, and programmatic channels, to help retailers maximise revenue from their digital signage networks. Remote health checks and playback verification further ensure campaigns run smoothly, which is critical for measuring returns accurately.
With retail media profit margins forecasted to hit 70–90% by 2026, the ability to verify campaign delivery and optimise content through real-time data is essential for making a strong business case. Additionally, the platform’s screen grouping feature allows retailers to roll out localised offers across specific regions simultaneously, improving efficiency while keeping content relevant.
sbb-itb-c231c83
2. General In-Store Digital Signage Systems
Impressions Tracking
In-store digital signage systems often use tools like sensors, camera analytics, foot traffic counters, and Bluetooth beacons to estimate how many people view a screen. These methods help measure reach - 70% of Americans report seeing digital video displays in the past month, compared to only 43% for internet ads. However, these numbers don't always tell the full story.
The main challenge is that high impression counts don't guarantee customer value or increased sales. As Arnaud Poirier from Displai explains:
"Just because content was displayed doesn't mean it was effective. Prioritise actions like engagement, conversion, or dwell time over screen uptime."
- Arnaud Poirier, Displai
Many systems remain disconnected from sales and inventory data, which limits their usefulness. Traditional setups often separate signage metrics from point-of-sale data and traffic analytics, making it hard to attribute results accurately. Additionally, systems incorporating facial recognition may raise privacy concerns. While impression counts can highlight reach, metrics like engagement and dwell time provide deeper insights into how effective the content really is.
Engagement Metrics
Dwell time is a key metric that shows how long viewers stay engaged with signage. Effective displays typically capture attention for 3–8 seconds. Another critical measure is the attention rate, which tracks the percentage of passersby who actually look at the display. This is often assessed using camera analytics. Interactive features, such as touchscreens, QR codes, and gesture-based responses, take engagement to the next level. These elements attract 63% more attention and boost brand awareness by up to 47.7% compared to static displays.
A great example comes from a Melbourne fitness centre that teamed up with Spaik Digital Advertising in August 2025. They incorporated interactive touchscreens into their customer experience, allowing members to access personalised programmes and tailored offers. The result? An 18% increase in membership conversions. Metrics like these show that tracking specific actions, rather than just passive views, helps identify what content connects with audiences. When engagement data is clear, it directly supports accurate ROI calculations and links audience interaction to campaign success.
ROI Measurement
To measure ROI effectively, start by collecting 4–8 weeks of baseline sales and engagement data. Then calculate ROI using the formula: (Gain – Cost) ÷ Cost.
Consider the example of a Guangdong supermarket chain. They installed 50 screens to promote slow-moving snacks and drinks. By integrating the screens with their ERP system for real-time inventory updates and using countdown timers for offers, they achieved a 30.4% sales boost over three months while saving ¥20,000 in printing costs. For even more precise tracking, unique QR codes or promo codes displayed exclusively on signage can directly link sales to specific screens. As one supplier put it:
"If you can't measure, you can't optimise. If you can't optimise, you're wasting budget."
- Digital Signage Supplier
Measure your Digital Signage Audience | Create KPI Dashboards
Strengths and Weaknesses
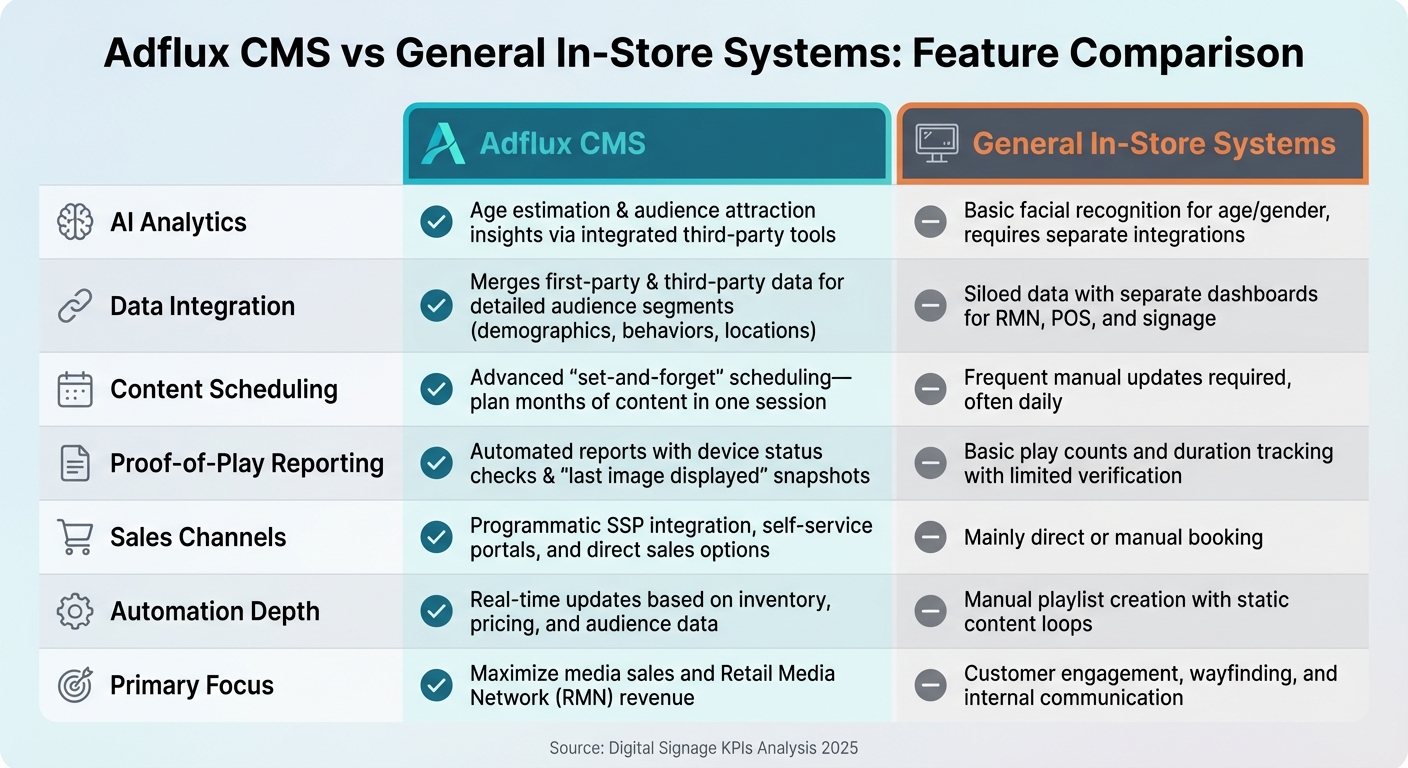
Adflux CMS vs General Digital Signage Systems Feature Comparison
When evaluating digital signage platforms, the depth of analytics and level of automation often define their performance. Here's a breakdown of how Adflux CMS compares to general in-store systems:
| Feature | Adflux CMS | General In-Store Systems |
|---|---|---|
| AI Analytics | Offers age estimation and audience attraction insights through integrated third-party tools | Basic facial recognition for age and gender, often requiring separate integrations |
| Data Integration | Merges first-party and third-party data to create detailed audience segments based on demographics, behaviours, and locations | Data is siloed; separate dashboards for RMN, POS, and signage |
| Content Scheduling | Advanced "set-and-forget" scheduling - plan months of content in one session | Requires frequent manual updates, often daily |
| Proof-of-Play Reporting | Automated reports with device status checks and "last image displayed" snapshots | Basic play counts and duration tracking with limited verification |
| Sales Channels | Includes programmatic SSP integration, self-service portals, and direct sales options | Relies mainly on direct or manual booking |
| Automation Depth | Real-time updates based on inventory, pricing, and audience data | Manual playlist creation with static content loops |
| Primary Focus | Designed to maximise media sales and Retail Media Network (RMN) revenue | Focused on customer engagement, wayfinding, and internal communication |
This table underscores how Adflux CMS leverages integrated analytics and automation to simplify campaign management.
One of the most noticeable differences is in performance measurement. General systems often report only that content has been played, offering little insight into its actual impact. Adflux, however, provides deeper analysis, ensuring transparency and actionable insights.
Operational efficiency is another standout factor. While general systems require daily manual updates, Adflux automates content updates in real time, responding to inventory changes and audience data. This efficiency is significant - studies show that aligning performance metrics with business goals leads to improved operational outcomes in 70% of cases.
For retailers building Retail Media Networks, the gap is even more pronounced. Adflux is purpose-built for RMN, featuring programmatic sales channels and self-service portals that allow third-party advertisers to manage their campaigns independently. General in-store systems, primarily designed for internal communication, lack these revenue-driving features. With RMN profit margins projected to hit 70–90% by 2026, this difference has a direct impact on profitability.
Conclusion
Pick a measurement method that fits your campaign goals and operational needs. If your main objective is driving revenue through Retail Media Networks, a specialised platform like Adflux CMS can be a game-changer. It offers automation, programmatic integration, and proof-of-play reporting - features that advertisers expect and that can help boost your bottom line.
That said, not all retailers prioritise revenue generation. For those focusing on internal communication or enhancing customer experience, simpler in-store systems might do the job - provided you’re okay with manual updates and basic play counts. However, if you’re tracking critical KPIs like sales lift (aiming for a 15–25% increase for promoted items) or conversion rates, you’ll need more advanced analytics and POS integration to go beyond surface-level metrics.
Start with 4–8 weeks of baseline data and focus on 3–5 key metrics within the first 30 days. For Australian retailers, metrics like sales lift, dwell time, and system uptime (targeting 99% or higher) should be prioritised. Research shows that businesses using strong performance metrics are 27% more likely to outperform their competitors over a five-year period.
Your choice of measurement tools should also reflect how you use your screens. If you’re selling ad space, features like automated proof-of-play reporting and real-time audience targeting are non-negotiable to meet advertiser demands. But if you’re just promoting weekly specials, simpler tracking options might be enough.
Finally, integrate your CMS with tools like POS systems, inventory APIs, and foot traffic counters. This ensures you’re measuring campaign impact accurately. Without proper integration, normal sales fluctuations could easily be mistaken for campaign results.
FAQs
Which 3–5 digital signage KPIs should I track first?
When it comes to tracking the success of your digital signage campaigns, there are a few key performance indicators (KPIs) that stand out:
- Impressions or views: This measures how many people have seen your signage, giving you an idea of your campaign's reach.
- Audience engagement metrics: Metrics like dwell time or interaction rates reveal how actively viewers are engaging with your content.
- Conversion rates: This tracks how many viewers take the desired action, whether it's making a purchase, signing up, or visiting a website.
These KPIs are essential for understanding your campaign's reach, engagement levels, and overall effectiveness. By keeping an eye on these, you can fine-tune your strategy to get the best results.
How do I link screen performance to POS sales without guesswork?
To connect screen performance directly to POS sales, leverage technology that delivers real-time data on audience engagement and sales outcomes. Tools such as analytics software, camera-based recognition systems, and sensors can monitor metrics like foot traffic, dwell time, and content interaction. These insights help you align screen performance with POS sales data, removing uncertainty and enabling precise, data-backed campaign adjustments.
What’s the simplest way to prove a campaign actually played (proof of play)?
The easiest way to confirm that a campaign has run is by using proof of play analytics. These tools monitor and log when content is displayed on digital signage screens, capturing essential details like how long it played and how often. This data helps ensure campaigns are tracked accurately and provides insights for evaluating performance.
Adflux Editorial
Retail media, programmatic DOOH, and digital signage insights for Australian retailers.
Ready to build your retail media network?
Talk to the Adflux team about how the platform can work for your screens.